Standard Reports: User Activity Summary
TOPICS COVERED IN THIS ARTICLE
- How To Run The User Activity Summary Report
ENVIRONMENT
LeadManager
STEP BY STEP INSTRUCTIONS
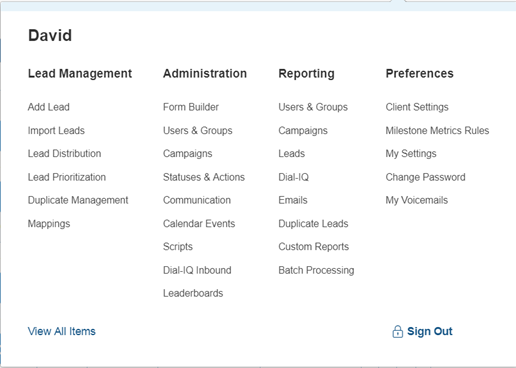
Access the Menu page by clicking on your name in the upper right of the header.

Click Users and Groups (Reporting).
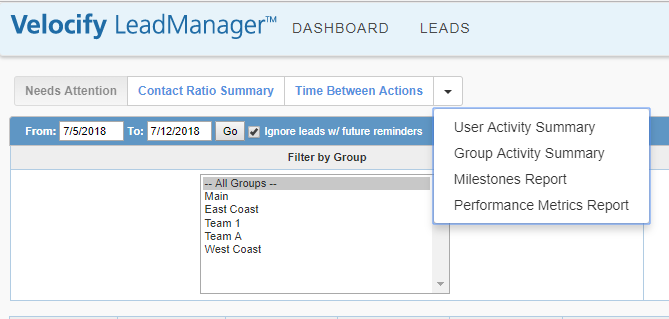
Click on the drop-down arrow and click User Activity Summary.
When to Use The Report
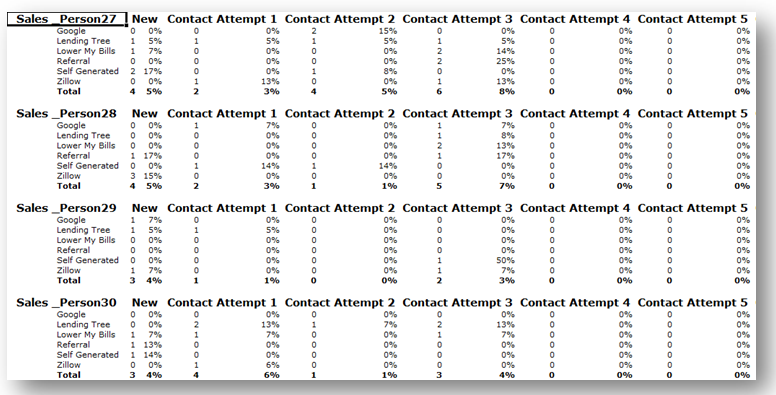
The User Activity Summary provides information about the status of your leads within each of your users' pipelines. Our most successful clients generally use this report in several different ways:
- Identify various performance metrics and ratios and compare them among various users (such as an "Application Ratio" and "Funding Ratios"). Run the report in the Historical mode. (See "Snapshot vs. Historical," below for more details.)
- To gain insight into each user's pipelines and potential back-logs. Run the report in the Snapshot mode.
- To identify potential fraud when users return or inactivate high percentages of leads
Running the report
Run the report by clicking the Go button.
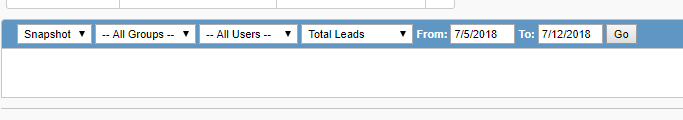
However, there are several options available when running the report that you will find useful:
- SNAPSHOT and HISTORICAL VIEWS. Please see Snapshot vs. Historical," below.
- DATE RANGE FILTERING: To the left of the Gobutton, specify a start and end date. This will filter the leads used to generate the report based on the date on which they were added to your LeadManager. For instance, you might compare the contact ratio of the leads you received last month to the leads that you received in the prior month.
- GROUP FILTERING:You can filter the output of this report by group. This is useful if you wish to compare the performance of different teams. If a group manager is given access to reports, they will only see the performance of their own team.
- USER FIRLTERING:You can see the performance of an individual user.
- TOTAL LEADS vs. PREVIOUS STATUS. This is useful only to a tiny minority of our clients who have a completely linear sales cycle.
Snapshot vs. Historical
- Instead of providing information about the current status of each lead, a Historical report provides information about the number of leads that have ever been in a given status. To run the User Activity Summary as a Historical report, select "Historical" from the Snapshotdropdown menu in the upper-left-hand corner of this report.
- This is easier to understand with an example. Suppose you generate 10 leads in the New Four of these leads move directly to the Applicationstatus. Of these four, two then go to the Funded status, and two then go to the Inactive status. The other 6 move directly to the In Process status, then on to the Inactive status.
- The results would appear as follows:
|
New |
In Process | Application | Funded | Inactive | |
|
Snapshot |
0 (0%) | 0 (0%) |
0 (0%) |
2 (20%) |
8 (80%) |
| Historical |
10 (100%) |
6 (60%) | 4 (40%) |
2 (20%) |
8 (80%) |
- It’s easy to see the value of the Historical report in this context. From the Snapshot view, we can only determine that 20% of our leads eventually arrive in the Funded status, and 80% of our leads arrive in the Inactive status. We can deduce that we have a 20% funded ratio, but we don’t know what got us there.
- From the Historical view, it’s easy to determine that 40% of our leads generate applications. So, we can say that we have a 40% application ratio. We can also see that 20% of our leads are funded, and 80% become inactive.
:You can click the Export to Excel button to export the report results to an excel spreadsheet.
- After clicking Export to Excel a download dialog will display.
- Click Save File and then OK.
- Save the spreadsheet and open it.