Standard Reports: Time Between Actions
TOPICS COVERED IN THIS ARTICLE
- Accessing the Time Between Actions Report
- What the report Shows
- How to Use the Report
- Lead Assignment time
ENVIRONMENT
LeadManager
STEP BY STEP INSTRUCTIONS
Access the Menu page by clicking on your name in the upper right of the header.

Click View All Items.
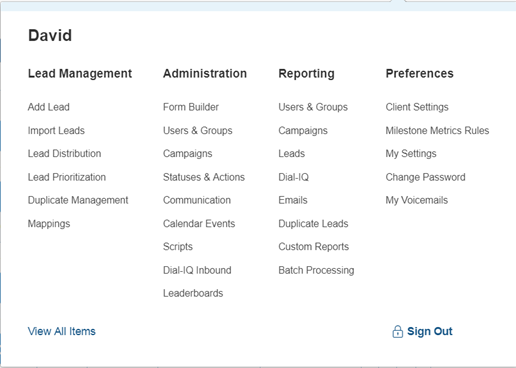
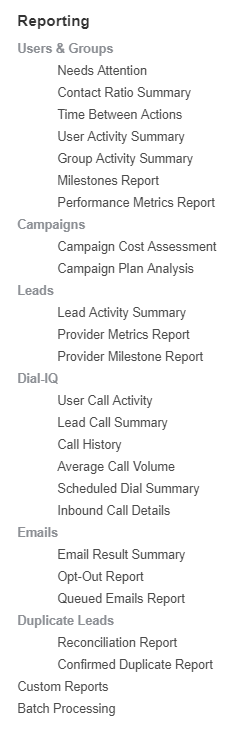
Under Reporting / Users & Groups, click Time Between Actions.
Information Displayed in the Report
The Time Between Actions report is one of the more popular reporting features in LeadManager. It provides information on how long it takes users to perform actions, such as making initial contact with leads or how long it took between the initial attempt to contact and making actual contact.
Below are just some of the ways the Time Between Actions report can help you to better understand your business:
- Track the average number of actions taken on each lead
- Track the average time that it takes for a user to make contact with a lead once the lead is assigned to that user
- Track the average time that it takes for a user to take the 1st through their 10th action on each lead assigned to that user
Speed to Contact Attempt Metric:
- One of the most common uses of the Time Between Actions report is measuring how long it takes to make that critical first contact attempt with a lead.
- This information is available in both the Time Between Actions report, as well as on the Dashboard listed as Speed to Contact Attempt.
- When viewing the Speed to Contact Attempt metric on the Dashboard at the User or Group level, the result measures the difference between when the lead was assigned to that specific User or Group and the first contact attempt.
- When viewing the metric at the Company level, the result measures the difference between when the lead was input into LeadManager and the time the first contact attempt was made.
How to Use the Time Between Actions Report
Once you access the Time Between Actions Report, you will see the following options at the top of the report:
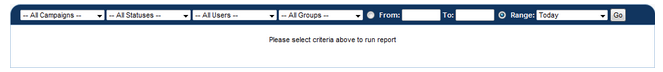
It is possible to filter the report to generate more targeted data:
- Campaign Filtering: By default the report includes data for all campaigns. You can limit the results of the report to one or more campaigns.
- Status Filtering: Show leads only from a specific status or set of statuses.
- User Filtering: Measure the performance of an individual user.
- Group Filtering: Measure the performance of an entire group, which is useful to compare the effectiveness of different teams within your organization. Group managers who are given access to reports will be able to see the performance of their own team.
- Date-Range Filtering: You can either use the From and To fields or the preset Range drop-down to look at a specific span of time when generating reports.
A broad-based report can be generated from this toolbar by selecting Go at the far right.
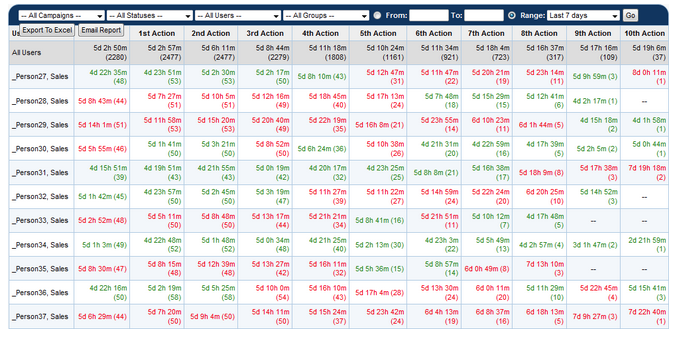
Export to Excel will allow file download as an .xls which can then be opened as a spreadsheet.
Lead Assignment
- It is possible to determine the lag time between when a lead is first entered into LeadManager and when it is assigned to a User or Group using the Time Between Action report’s Speed to Contact Attempt metric.
- This is accomplished by first running the report at the Company level, then running the report at the User or Group level for the same date range.
- Subtract the User or Group’s Speed to Contact Attempt time from the Company level’s Speed to Contact Attempt time.
- The resulting number is the time taken from when the lead was first entered into LeadManager and when it was assigned to a User or Group.