Standard Reports: Campaign Cost Assessment
TOPICS COVERED IN THIS ARTICLE
- How to run the Campaign Cost Assessment report
- What type of information the report can display
ENVIRONMENT
LeadManager
STEP BY STEP INSTRUCTIONS
This report helps you get an idea of your ROI by campaign by tracking lead performance throughout the sales cycle.This report is calculated by taking the total amount spent on leads in a campaign and divides it by the number of leads in each status, per user.
Access the Menu page by clicking on your name in the upper right of the header.

Under Reporting, click Campaigns.
The reporting page will default to the Campaign Cost Assessment report.
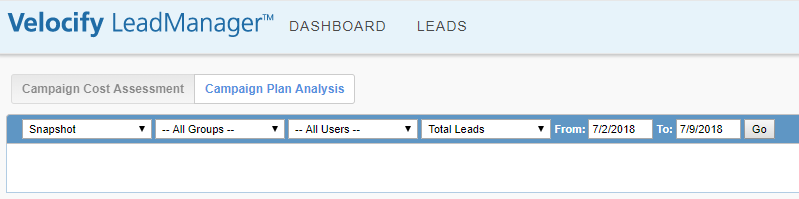
Apply the desired filters.

Information Found in the Report
Example 1
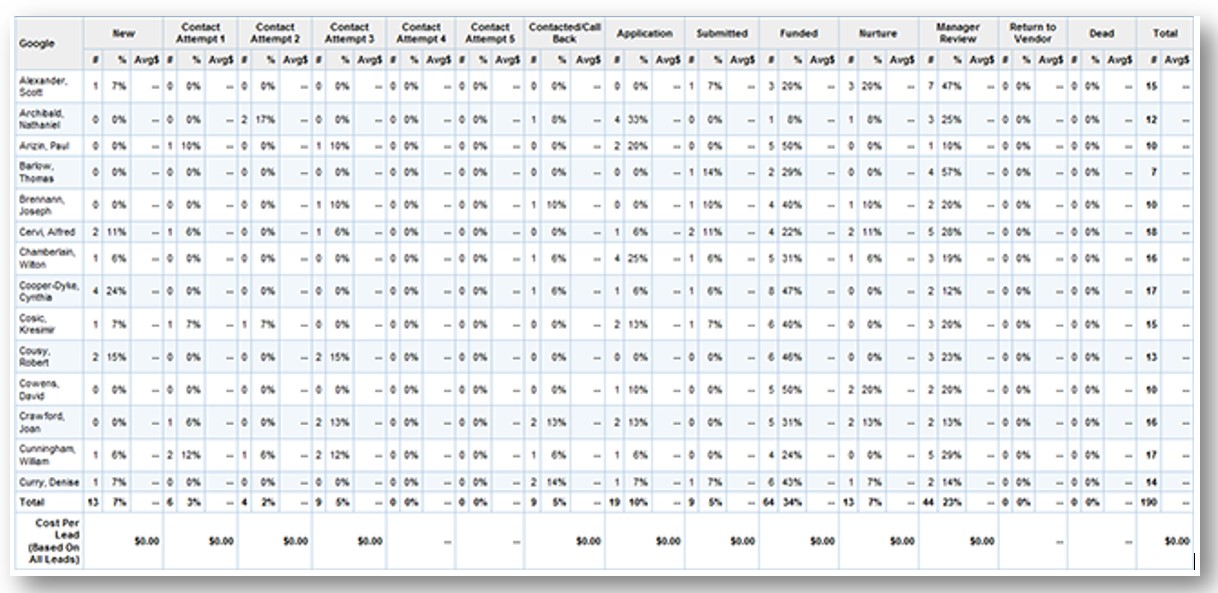
- Examples of questions this report answers are: “How much did we pay for each lead that made it to the Qualified status the Lending Tree Campaign?” and “How much did we pay for each lead that made it to the Funded status the LowerMyBills Campaign?”
- Note that for this report to give results in this column, cost per lead must be entered before Leads enter the system.
- Each campaign has its own table which lists users down the left and statuses across the top.
Example 2
This example shows two columns, corresponding to the New and Funded statuses and all the users in the selected group. Columns are split into three sub-columns.
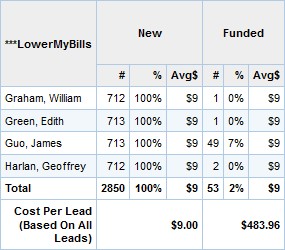
- # – This displays the total number of leads from this campaign that were assigned to the user that reached or passed through the status
- %– This displays the percentage of total leads from the campaign (added during the selected date range) that the number in the # column represents
- Avg$ – This displays the average cost of the leads that were assigned to the user that reached or passed through the status
The User row
This is a section from a Campaign Cost Assessment that looks at only two statuses in the LowerMyBills Campaign: New and Funded.
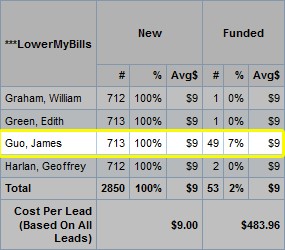
The totals in the James Guo row indicate that:
- 713, or 100%, of the leads reached or passed through the New status
- The average cost per lead that reached or passed through the New status is $9
- 49, or 7%, of the leads reached or passed through the New status
- The average cost per lead that reached or passed through the Funded status is $9
Cost Per Lead (Based on All Leads)
This row displays what is likely the most useful data in the report. The totals in this row are calculated by dividing the total number of leads from this campaign (from the selected date range) by the total number of leads that reached or passed through the New and Funded status respectively.
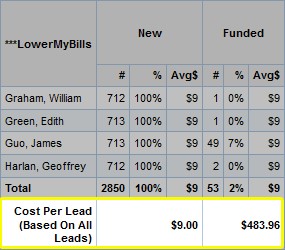
- The total cost for leads that reached or passed through the New status is $9.00. (100% of the leads from the selected campaign and date range were at some point in the New status, so $9.00 is also the actual cost of the lead)
- The total cost for leads that reached or passed through the Fundedstatus is $483.96