Dial-IQ: Standard Reports: Contact Ratio Summary
TOPICS COVERED IN THIS ARTICLE:
How to run the Contact Ratio Summary report
ENVIRONMENT:
LeadManager
DETAILS:
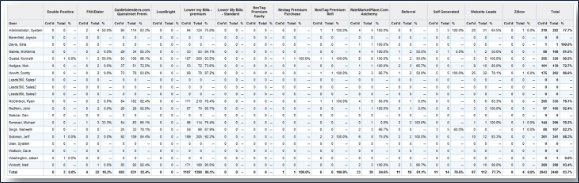
The Contact Ratio Summary provides information about your contact ratios. Contact Ratio is simply the percentage of total leads that have been contacted by a user.
Our most successful clients use this report in several different ways:
-
Track their overall company contact ratio to judge the value of recent workflow and process changes
-
Compare total contact ratios among different users to gauge LO performance
-
Compare total contact ratios among different campaigns (lead sources) to gauge lead provider performance
This report is not accurate if you permit your users to change lead status manually.
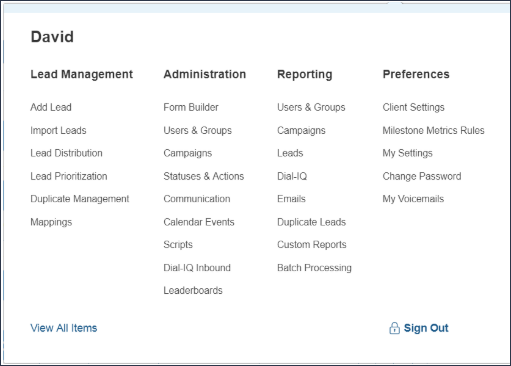
First, access the Menu page by clicking your name in the upper right of the header.

Under Reporting, click Users & Groups.
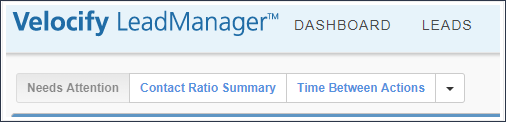
Click Contact Ratio Summary.
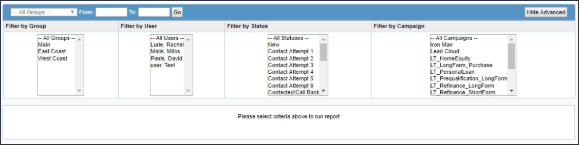
Apply desired filters.
-
There are several filtering options available when running the report that may be useful.
-
Click the Show Advanced button to set additional filters
Run the report by clicking Go.
-
Filter by Date Range. To the left of the Gobutton, specify a start and end date. This will filter the leads used to generate the report based on the date on which they were added to Velocify™. For instance, you might compare the contact ratio of the leads you received last month to the leads that you received in the prior month.
-
Filter by Group. You can filter the output of this report by group. This is useful if you wish to compare the performance of different teams. If a group manager is given access to reports, they will see only the performance of their own team.
-
Filter by User. You can see the performance of one or more users individually. This is most useful if you are interested in seeing the total performance of several users who are not grouped within a team.
-
Filter by Status. You can filter the leads used to generate this report based on their status. For instance, you might omit a “Returned” status to identify your contact ratio for your “good” leads.
-
Filter by Campaign. You can filter the leads used to generate this report based on campaign.
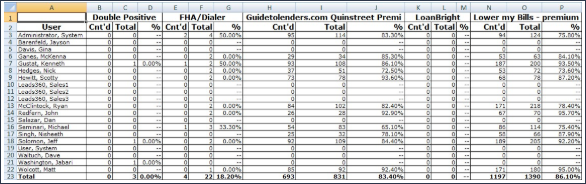
You can click the Export to Excel button to export the report results to an excel spreadsheet.
After clicking Export to Excel, a download dialog will pop up.
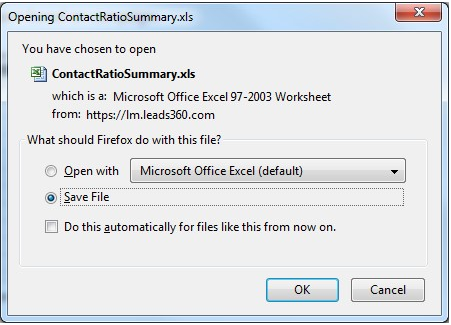
Select Save File and click OK.
Example Results