Dashboard page
Overview
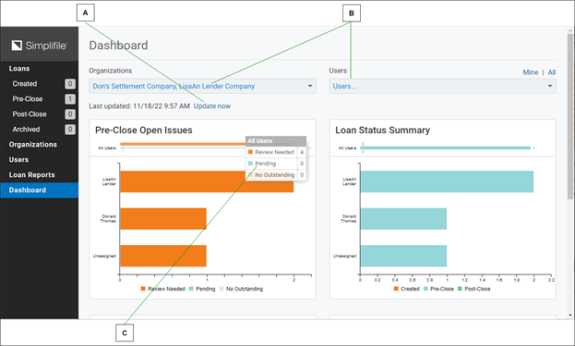
You can use the Dashboard item in the navigation menu to get an overview of work that needs to be done and work that has already been completed. Below is an example of the top of the dashboard.
| Letter | Description |
|---|---|
| A | Select here to update the data to real time. |
| B | Use the dropdown lists to limit the information that displays on the dashboard. |
| C | Hover your mouse pointer over any bar to see a breakdown of the person’s or group’s loan needs. Select the bar to display the loans of each type assigned to that person or group. |
The dashboard displays graphs that let you view who has outstanding loans, and why the loans are outstanding.
Pre‑Close Open Issues graph
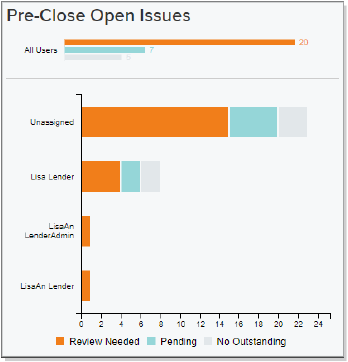
This graph shows how many loans with a Pre‑Close status need work from the users you choose from the dropdown list or from your collaborators. A summary graph for all users displays at the top.
The larger graph changes depending on your choice of organizations and users. It breaks down whether there are loans with items each person needs to work on (orange) or that the collaborator needs to work on (blue). It also shows how many loans assigned to each person have no outstanding items, or no work needed.
Hover the mouse pointer over a bar to show the count of loans with each type of task. Select a colored bar to view the loans referenced.
Loan Status Summary graph
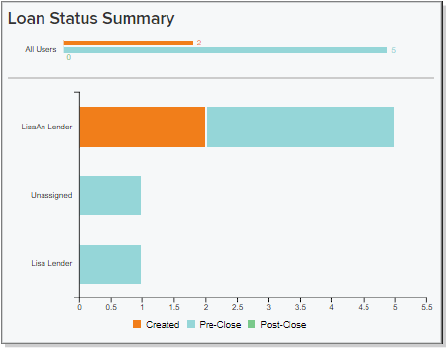
This graph shows the number of loans with each status currently being worked on by members of your organization. A summary graph for all users displays at the top.
The larger graph changes depending on your choice of organizations and users. It breaks down for each person how many loans of each status are assigned to him or her.
Hover the mouse pointer over a bar to show the count of loans with each type of task. Select a colored bar to view the loans referenced.
Created Unassigned Settlement graph
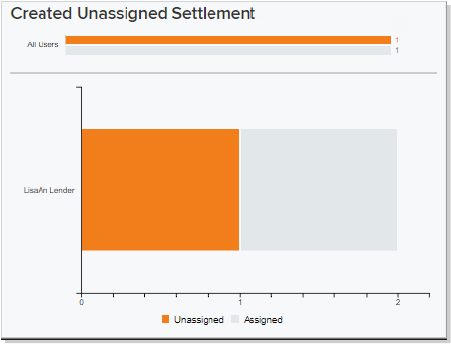
This graph shows the number of loans with a Created status that have been assigned to lender users at your company but which have not been yet assigned to a settlement company. A summary graph for all users displays at the top.
The larger graph changes depending on your choice of organizations and users. It breaks down for each person how many Created loans without settlement companies have been assigned to him or her.
Hover the mouse pointer over a bar to show the count of loans with each type of task. Select a colored bar to view the loans referenced.
Closing Date Forecast graph
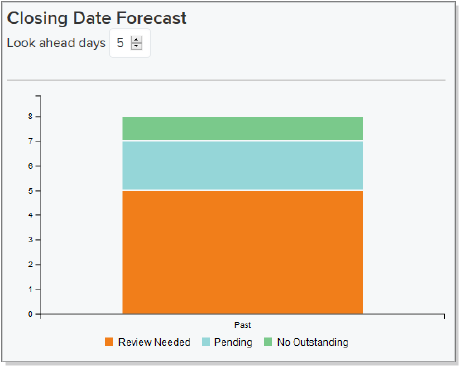
This graph shows the number of loans scheduled to close within the number of days you choose from the dropdown list, and how many of those loans need review by you (orange) or your collaborator (blue).
Hover the mouse pointer over a bar to show the count of loans with each type of task. Select a colored bar to view the loans referenced.
I want to ...
Choose my organization or organizations to display in the dashboard
- Open the Dashboard page.
- Above the Users dropdown field at the right, select the Mine link. The Dashboard page changes to display information your loans.
- In the Organizations dropdown field, mark the organization or organizations to display in the dashboard.
Choose all organizations to display in the dashboard
- Open the Dashboard page.
- Above the Users dropdown field at the right, select the All link. The Dashboard page changes to display information your organization loans.
- In the Organizations dropdown field, mark the organization or organizations to display in the dashboard.
Choose my user or users to display in the dashboard
- Open the Dashboard page.
- Above the Users dropdown field at the right, select the Mine link. The Dashboard page changes to display information your loans.
- In the Users dropdown field, mark the user or users to display in the dashboard.
Choose all users to display in the dashboard
- Open the Dashboard page.
- Above the Users dropdown field at the right, select the All link. The Dashboard page changes to display information your organization's loans.
- In the Users dropdown field, mark the user or users to display in the dashboard.