A Customization Reporting tool has been added to the Encompass Home tab to assist Encompass administrators in moving from Encompass to the Encompass Lending Platform by providing visibility into the custom code used in custom forms, the advanced code used in business rules and custom fields, as well as the plugins and SDK apps currently in use with Encompass. The tool enables administrators to complete the following tasks to ensure that custom code and advanced code continue functioning properly in Encompass when leveraging the Connect family of products:
View an inventory of the most heavily used custom forms.
Identify business rules and custom fields with advanced code that are incompatible with the Encompass Lending Platform.
View data about custom forms and advanced code and prioritize adjustments that must be made before migrating code to the Encompass Lending Platform.
Identify plugins to migrate to the Encompass Lending Platform.
Identify SDK apps to migrate to the Encompass Lending Platform.
For example, when implementing a migration plan, administrators can give higher priority to reviewing and updating custom forms and advanced code that are used more frequently, assign a lower priority to those that are used less frequently, and decide whether to rework custom forms and advanced code that are not used at all.
ICE Mortgage Technology Professional Services can also assist with determining which custom forms and advanced code need to be reworked in preparation for the Encompass Lending Platform.
The Customization Reporting tool is located at the bottom of the right column on the Home tab and is visible to the Encompass administrator and to any Encompass user who has been assigned the Administrator or Super-Administrator persona. The tool contains the following two tabs:
Plugin – This tab lists the name of each Encompass plugin and the date when the plugin was last loaded.
SDK – This tab lists the name of each SDK app, the date when the app was last launched or run, and the number of times the app was run or launched within the specified date range.
The tool pulls data from Encompass databases each day during the early morning hours and includes data available as of 11:59:59 P. M. Pacific Time on the previous day.
The Custom Form tab lists custom forms that have been accessed within the specified time range, provides details about the number of times the form has been accessed, and indicates whether custom code is used in the form. Data is drawn from a database linked to the client ID and includes aggregated information from the client’s test and production environments, including macros and VB.NET code tied to events as well as codebase assemblies.
Use the days field at the top of the form to specify the number of days prior to the current date that will be included in your search. Queries can range from 1 to 90 days (3 months). Custom forms display on the tab if they were accessed during the specified time period.
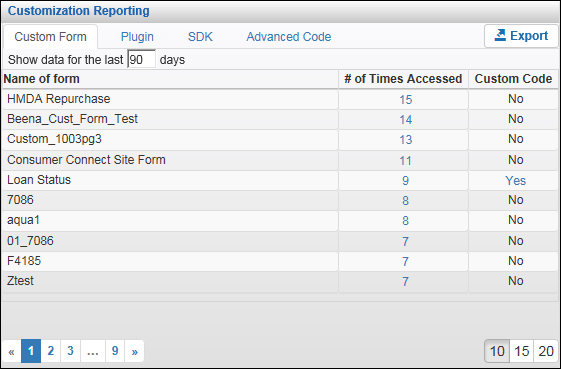
Three columns display on the tab:
Name of form – The names of the custom form.
# of Times Accessed – The number of times the forms have been accessed during the specified time range.
Custom Code – Indicates whether the form includes custom code.
To View Detailed Information About User Access:
In the # of Times Accessed column, click a number to view the Encompass users who have accessed the custom form during the specified time period.

Use the Detailed View pop-up window to view the User IDs for each Encompass user who accessed the form along with the number of times the user accessed the form during the specified time period.
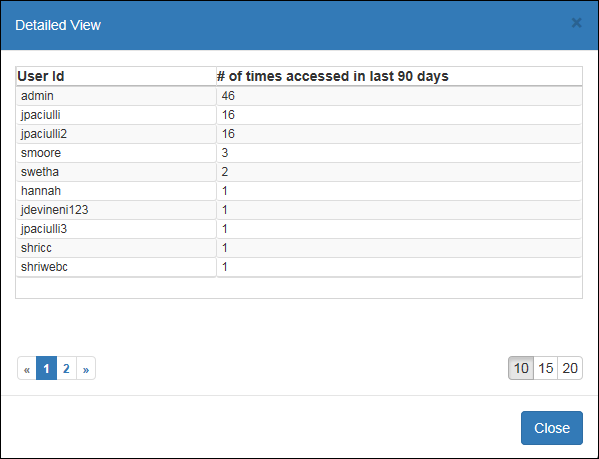
Click the page numbers on the lower left to navigate to additional pages on the window, if applicable.
Click the numbers on the lower right to adjust the number of entries that display on the window.
To View Detailed Information About Custom Code:
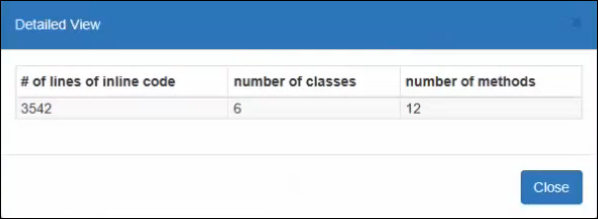
If there is custom code, click the Yes link in the Custom Code column to view details of the code.

The Detailed View window opens and displays information about inline custom code and custom code that is part of the codebase:
The number of lines of inline code
The number of custom code classes in the codebase
The number of custom code methods in the codebase
To Export Data from the Custom Forms Tab:
Click the Export button on the upper right to export the data to a CSV (comma-separated values) file, which can be open with a spreadsheet application such as Microsoft Excel or a text editor.
When the File Download window opens, click the Save button.
Navigate to the location where you want to save the file, and then click OK.
The exported file includes an entry for each custom form listed on the Custom Forms tab. The export file includes the following information for each entry:
Form name
Custom code indicator (Y/N)
Number of inline codes
Number of classes in the codebase
Number of methods in the codebase
Users who accessed the form within the selected time range
Number of times the form was accessed within the selected time range
The Advanced Code tab displays data about advanced code for custom fields and business rules that has been extracted from the Client Encompass Database and validated for compatibility with the Encompass Lending Platform. The data is based on the Encompass instance ID, so advanced code data is validated only in the environment in which the tool is running. Administrators must open the tool in each environment (for example, test and production environments) to view advanced code data specific to those environments.

Four columns display at the top of the tab:
Instance ID – The Instance ID for the environment.
Total Checked – The total number of occurrences of advanced code that have been checked against the Encompass Lending Platform.
Passed – The number that have passed the validation process.
Failed – The number that have failed the validation process. The tool displays results for both active and inactive rules.
For additional information about support for advanced code and details about whether existing business rules work in the Encompass Lending Platform, refer to the knowledgebase articles for Advanced Code Support in Encompass Next Gen (article #12998). To access the articles, click the Go to Resource Center link on your Encompass Home tab, enter the article title or number in the search field on the upper right, and then click the Find icon.
To View and Resolve Issues with Failed Code:
Click a number in the Failed column to view details about code that failed the validation.

Use the Detailed View window to view a table with the Rule Name (name of the business rule or custom field), the Rule Type (loan custom field or type of business rule), the Usage Type for the business rule or code, and an indicator of whether the rule or code is currently active.
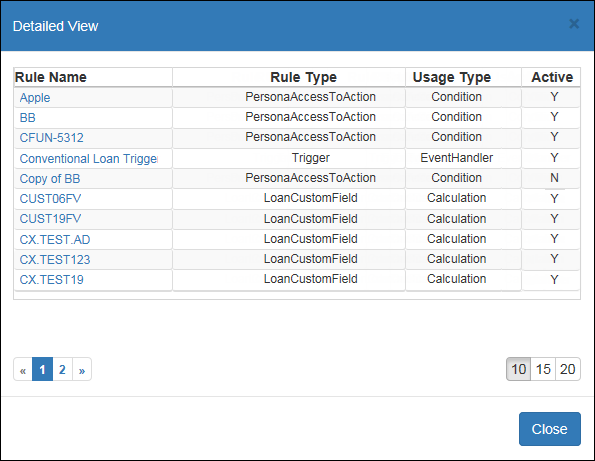
Click the page numbers on the lower left to navigate to additional pages on the window, if applicable.
Click the numbers on the lower right to adjust the number of entries that display on the window.
Click an entry in the Rule Name column to view the code, the reason for the code failure, and the location in the code where the failure occurred.
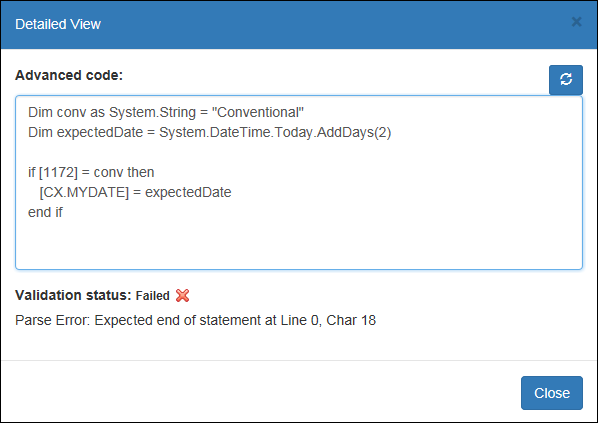
Locate the error, adjust the code, and then verify whether the updated code now passes the Encompass Lending Platform validation test. After updating the code, click the Refresh icon on the upper right to run the validation check again. If the updated code is compatible with the Encompass Lending Platform, the Validation status changes from Failed to Success.
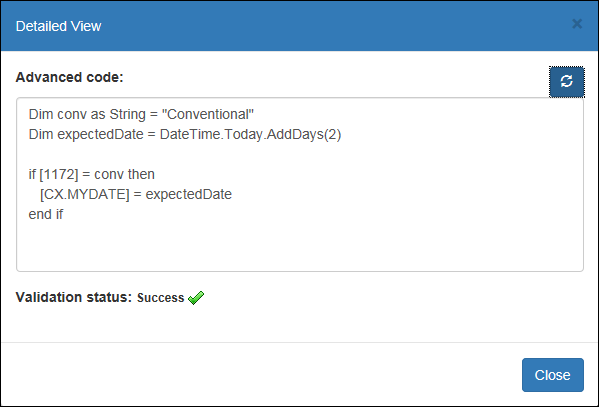
NOTE: Changes made to the code in the Customization Reporting tool are for testing and validation purposes only. Data used to validate the code is extracted from Encompass databases once a day and may be outdated by the time the code is reviewed in the Customization Reporting tool. For this reason, changes made on the Detailed View pop-up window are not saved back to Encompass. This eliminates the possibility of overwriting or corrupting rules that have changed after data is pulled from the Encompass database.
To Export Data from the Advanced Code Tab:
Click the Export icon on the upper right to export the data to a CSV (comma-separated values) file, which you can open with a spreadsheet application such as Microsoft Excel.

When the File Download window opens, click the Save button.
Navigate to the location where you want to save the file, and then click OK.
The exported file includes an entry for each rule or code that failed. The following information displays for each entry in the export file:
Instance ID
Rule name
Rule type
Usage type
Active indicator for rule or code (Y/N)
Original code
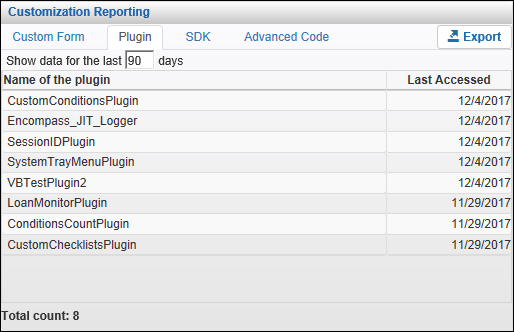
The Plugin tab lists the name of each Encompass plugin and the date when the plugin was last loaded within the specified date range. Use the days field at the top of the form to specify the number of days prior to the current date that will be included in your search. Queries can range from 1 to 90 days (3 months). Plugins display on the tab if they were loaded during the specified time period. Data is drawn from a database linked to the client ID and includes aggregated information from the client’s test and production environments.
Two columns display at the top of the tab:
Name of the plugin – The names of the plugins.
Last Accessed – The date when plugin was last loaded within the specified time range.
To Export Data from the Plugin Tab:
Click the Export icon on the upper right to export the data to a CSV (comma-separated values) file, which you can open with a spreadsheet application such as Microsoft Excel.
When the File Download window opens, click the Save button.
Navigate to the location where you want to save the file, and then click OK.
The exported file includes an entry for each plugin. The following information displays for each entry in the export file:
Name of the plugin
Date when the plugin was last loaded within the selected time range
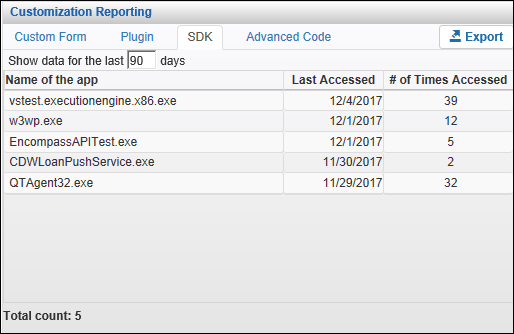
The SDK tab lists the name of each SDK app, the date when the app was last launched or run, and the number of times the app was launched or run within the specified date range. Use the days field at the top of the form to specify the number of days prior to the current date that will be included in your search. Queries can range from 1 to 90 days (3 months). Apps display on the tab if they were launched or run during the specified time period. Data is drawn from a database linked to the client ID and includes aggregated information from the client’s test and production environments.
Three columns display at the top of the tab:
Name of the app – The names of the apps.
Last Accessed – The date when app was last launched or run within the specified time range.
# of Times Accessed – The number of times the app has been launched or run during the specified time range.
To Export Data from the SDK Tab:
Click the Export icon on the upper right to export the data to a CSV (comma-separated values) file, which you can open with a spreadsheet application such as Microsoft Excel.
When the File Download window opens, click the Save button.
Navigate to the location where you want to save the file, and then click OK.
The exported file includes an entry for each SDK app with the following information:
Name of the app
Date when the app was last launched or run
Number of times the app was launched or run within the selected time range
Last Revision Date: 4/4/2023